
Directions (1-5): Study the following table carefully to answer the questions that follow–

(a) Rs. 303.7 lakhs
(b) Rs. 264.5 lakhs
(c) Rs. 329.4 lakhs
(d) Rs. 228.9 lakhs
(e) None of these

Q2. What is the percentage rise in profit of Company T in the year 2009 from the year 2004?
(a) 40
(b) 35
(c) 26
(d) 48
(e) None of these

Q3. If the profit earned by Company P in the year 2007 was Rs. 2.1 lakhs, what was the expenditure in that year?
(a) Rs. 30 lakhs
(b) Rs. 15 lakhs
(c) Rs. 23 lakhs
(d) Rs. 27 lakhs
(e) None of these

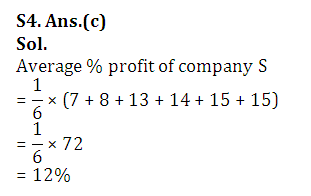
Q4. What was the average per cent profit of Company S over all the years together?
(a) 13.5
(b) 11
(c) 12
(d) 14
(e) None of these
Q5. What is the difference between the per cent profit earned by Company Q in the year 2005 and the average per cent profit earned by the remaining Companies together in that year?
(a) 4
(b) 2
(c) 1
(d) 3
(e) None of these

Directions (6-10): Study the following pie chart and table carefully to answer the following questions that follow:
Percentage break up of employees working in various departments of an organisation and the ratio of men to women in them.
Total Number of Employees = 1800
Percentage Break up of employees


Q6. What is the number of men working in the marketing department?
(a) 132
(b) 174
(c) 126
(d) 189
(e) None of these

(a) 7
(b) 5
(c) 19
(d) 15
(e) 10

Q8. What is the respective ratio of the number of women working in the HR department of the organisation and the total number of employees in that department?
(a) 3: 4
(b) 2: 5
(c) 2: 9
(d) 3: 7
(e) None of these

Q9. What is the respective ratio of the number of men working in the Accounts departments to the total number of employees working in that departments?
(a) 9: 2
(b) 7: 6
(c) 2: 9
(d) 6: 7
(e) None of these

Q10. The number of men working in the production department of the organisation forms what per cent of the total number of employees working in that department? (rounded off to two digits after decimal)
(a) 89.76
(b) 91.67
(c) 88.56
(d) 94.29
(e) None of these

Directions (11-15): Study the graph carefully to answer the questions that follow:
PERCENT INCREASE IN PROFIT OF THREE COMPANIES OVER THE YEARS

Q11. What was the per cent increase in profit of company Y in the year 2008 from the previous year?
(a) 2
(b) 10
(c) 20
(d) 14
(e) None of these

Q12. What was the approximate percent increase in the profit of company Z in the year 2005 from the previous year?
(a) 14
(b) 21
(c) 8
(d) 26
(e) 19

Q13. If the profit earned by company X in the year 2004 was Rs. 2,65,000, what was its profit in the year 2006?
(a) Rs 6,21,560
(b) Rs 4,68,290
(c) Rs 7,05,211
(d) Rs 4,82,300
(e) None of these

Q14. What is the average per cent increase in profit of company Z over the years?


Q15. Which of the following statements is TRUE with respect to the graph?
(a) Company X incurred a loss in the year 2004
(b) The amount of profit earned by company Y in the years 2006 and 2007 is the same
(c) Company Z earned the highest profit in the year 2008 as compared to the other years
(d) Profit earned by company X in the year 2004 is lesser than the profit earned by company Z in that year
(e) None of these

Click Here For Complete 30 Days Study-Plan IBPS Clerk Prelims 2017
For more Updates & Notifications for bank exams like SBI PO, SBI CLERK, IBPS PO, IBPS RRB, IBPS CLERK, IBPS SO, NIACL, SSC CHSL, SSC CGL etc. like our facebook page at :


0 comments:
Post a Comment